Comparison of Results
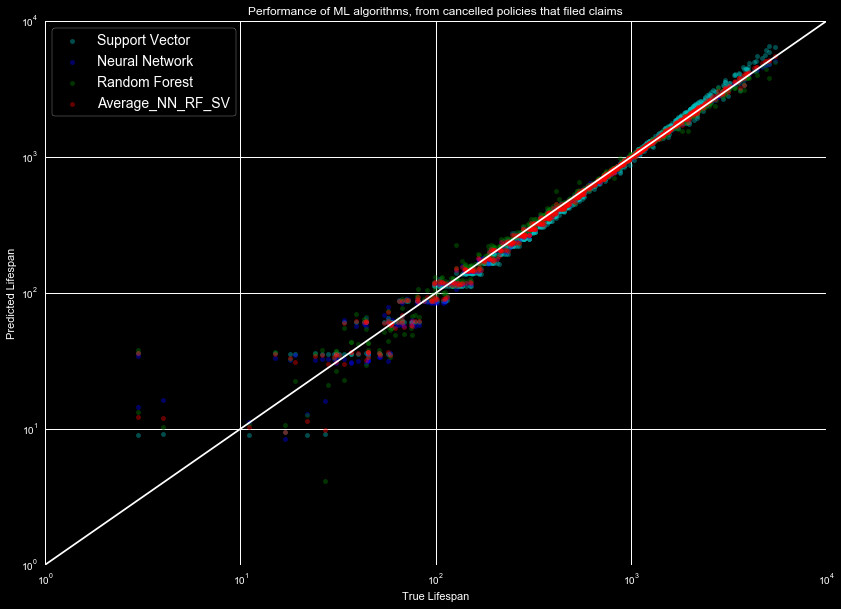
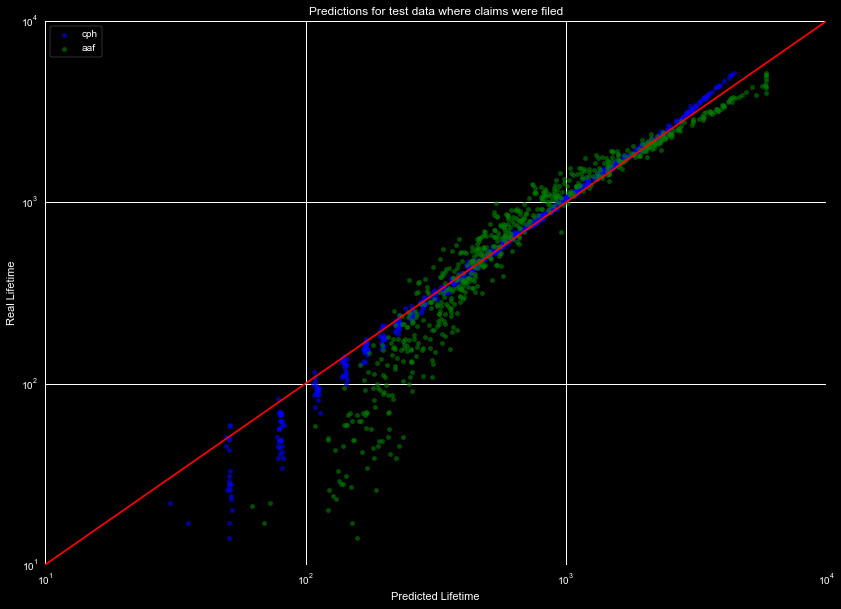
Finally, we can compare the results of the different models. They both performed well upon initial inspection, but we will utilize different metrics to compare results. In Figure 1 we reproduce the machine learning model predictions, and Figure 2 the survival function predictions, for the data set with claims filed.
We will use three metrics to describe our curves. For those unfamiliar with them, we provide a very brief overview:
- R2 - a metric that describes how much variation our model captures. While a useful metric, a curve such as the AAF fit in Figure 2 can still manage a high score, as the predicted lifespan increases with the real value, but it clearly misses important variation. A value of 1 is perfect, lower values are worse (typically greater than 0, but can be negative).
- Root mean squared error - similar to the standard deviation, equivalent to the standard deviation in our case, smaller values are better (best score is 0). Value indicates the typical spread of values around the mean, so that roughly 68% of points will be within the RMSE.
- Root mean squared log error - like the root mean squared error, however much more useful when the data spans many orders of magnitude. The lower the value the better, large negative numbers are the best.
Now, lets look at how these metrics compare with all our tests.
| Filed | No Filed | |||||||||||
|---|---|---|---|---|---|---|---|---|---|---|---|---|
| Metric | AAF | CPH | RFR | NNR | SVR | AVG | AAF | CPH | RFR | NNR | SVR | AVG |
| R2 | 0.932 | 0.988 | 0.992 | 0.999 | 0.981 | 0.996 | 0.951 | 0.983 | 0.990 | 0.953 | 0.960 | 0.993 |
| RMSE | 258.8 | 109.6 | 86.7 | 34.6 | 133.5 | 61.2 | 220.5 | 128.4 | 97.8 | 206.9 | 191.6 | 80.5 |
| RMSLE | 0.223 | 0.096 | 0.029 | 0.059 | 0.047 | 0.036 | 0.190 | 0.103 | 0.067 | 0.070 | 0.071 | 0.065 |
As can be seen in the table, all predictions have an R2 value that
is very good, this is due to the large range of value the lifespan takes, and
that the predictions roughly match this large range. Even the Alan Additive Fitter,
which shows strong systematics, has a value of 0.93. This makes it not the most
reliable estimator for this analysis.
The RMSE is easy to interpret, and gives a better measure of the goodness of fit. For the policies with claims filed, we can expect roughly 70% of the data to fall within a 35 day range with the Neural Network Regressor, whereas the Support Vector Regressor will have the same amount within roughly 130 days of the estimated value. By this metric, the Neural Network and Average of the 3 machine learning algorithms perform best for policies with claims filed, and the Random Forest Regressor and Average for policies with no filed claims.
The RMSLE shows a slightly different trend, with the Random Forest Regressor and Support Vector Regressor shining through on the claims filed set, and the no claims filed shows all machine learning algorithms performing equally well (the changes in the value are relatively small).
These show an overall successful ability to predict the lifespan of accounts. All the algorithms perform relatively well, but notably the CPH, RFR, and NNR perform the best for different sets and metrics. With more data we could perform more testing and training, but this is a very satisfactory performance.
From here, a more proper test would be to generate the standard deviation of the difference in the prediction-real value. These residuals form a normal distribution, which we could use with the predicted values to estimate the likelihood of canceling at any given time, including January 2017. However without the final testing data, we are unable to perform this final test. The lifetime predictions are a sufficient test for our project, and we were very successful.
Return to Home.