This page contains a high level overview of my dissertation work, with a focus on results. For a copy of the full dissertation, which contains details on methodology, please email me at markertsean0@gmail.com
Some helpful terms definitions for non-lensing-cosmologists:
Weak Lensing - Distortion of the shape of galaxies viewed behind a massive galaxy cluster, due to the distortion of space by gravity
Dark Matter - matter that does not interact with normal matter or light, but does impose a gravitational pull
Halo - A cloud of dark matter, that makes up most of the mass of galaxy or galaxy cluster
Virial Radius - Outermost radius of a galaxy cluster halo
Shear - Amount of stretching of the shape of galaxies due to weak lensing
Reduced Shear - The observed shear in weak lensing, shear combined with other distortion effects
Mpc - Megaparsec, a distance of measure roughly equivalent to 3 lightyears
h-1 Mpc - A Megaparsec distance measure, corrected for uncertainty in expansion of the universe
M◉ - Solar masses, equivalent to one mass of our sun
h-1 M◉ - Solar masses, corrected for uncertainty in expansion of the universe
Weak Gravitational Lensing of Clusters in Simulations
My dissertation was aimed at studying systematic effects the weak lensing observational methods used to recover galaxy cluster masses. There were two major components to this dissertation: implementing a more accurate density profile for mass estimation, and challenging the observational assumption that the clusters are spherical. The former should result in more accurate mass estimations, with decreases in bias and standard deviations in predicted cluster masses. The later is an examination of a fundamental assumption - as non-spherical mass profiles causes major increases in the standard deviation of predicted masses, and mass along the line of sight increases both the bias and standard deviation.
The NFW density profile is exclusively used to predict galaxy cluster masses, when fit to weak
lensing data (e.g.
1,
2,
3,
7,
9,
14,
15,
16,
17,
18).
The NFW profile is used for it's many strengths, simple analytical form for the reduced
shear (our fit parameter), only one free variable (mass), and widespread use of the NFW
profile for two decades. The Einasto profile provides a better fit to halos
(
4,
5,
6,
8,
10,
13),
but has a significantly more complicated expression for the reduced shear, requiring
more computational resources, and the weak lensing solution for which was only recently derived
by 11, 12).
The second part of my dissertation struck at a significantly more fundamental aspect
of weak lensing mass estimation. This assumption is that all of the shear is only in
a radial component, or, equivalently, the halos are completely spherically symmetric.
Though a good first order approximation, halos have significant structure where this
approximation can break down. This problem is further exasperated when structure is
added to the line of sight, and even a spherical halo would experience significant noise
due to inhomogeneities along the line of sight.
Procedure overview
For this project, we examine ~5,300 dark matter galaxy cluster halos at a z~0.5, using the MultiDark Planck simulation. We fit three different mass profiles: the NFW profile (which is traditionally used in weak lensing mass estimation), a truncated NFW profile cutoff at the virial radius, and the Einasto profile.
These fits are applied to spherical cutouts of the halos at the virial radius, a 10 h-1 Mpc cube centered on the halo, and the 10 h-1 Mpc cube with varying integration lengths along the line of sight, to a maximum of 400 h-1 Mpc. The spherical cutout gives us the best analysis of which density profile gives the most accurate masses. The 10 h-1 Mpc cube and longer integration lengths give an estimate of how masses along the line of sight introduce bias and spread to our fit masses, and carry implications for surveys that look deeper at galaxy clusters.
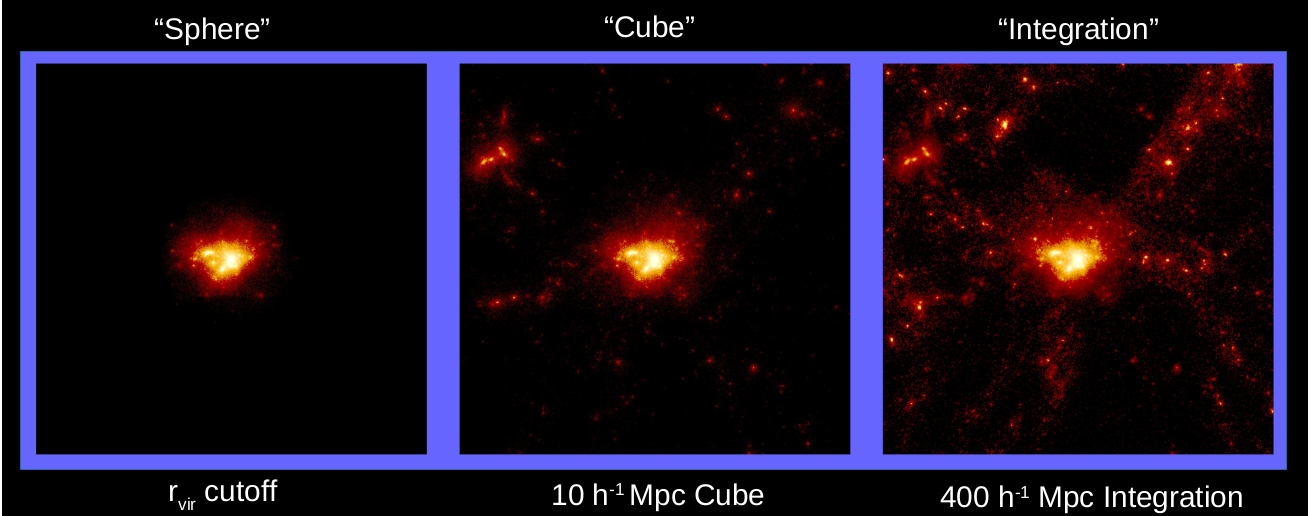
We estimated tens of thousands of halo masses from MultiDark simulations using weak lensing analysis, and fitting our density profiles. Observationally the reduced shear, gtot is measured. But, the assumption of spherical halos equates this to gtan, the reduced shear components that are only sensitive to radial variations. This is required for the observational density profile fitting method. The actual relationship between these two is: gtot2 = gtan2 + gsec2, where gsec is the reduced shear due to non-radial variations in the halo mass. To test this assumption, we fit both the tangent component of reduced shear gtan, and the total reduced shear (gtot)
Results - Fitting Different Density Profiles
First we will compare different density profiles. We see in Figure 2 a six
panel grid, each panel containing fits to the true mass on the x-axis (M200)
and the measured weak lensing mass on the y-axis (Mwl). Each contains
a 1:1 line in blue, and the best fit line as a red dash. The bias and standard deviation
of each best fit line is in the lower right corner of each panel. The left panels are
our spherical mass cutouts, fit only to the galaxy cluster, and the right panels
are the 10 h-1 Mpc cubes, which contain local structure. The top panels are
the truncated NFW profile, the middle are the standard NFW profile, and the bottom
is the Einasto profile. These are fit to the total reduced shear, gtot,
so match what observers actually measure.
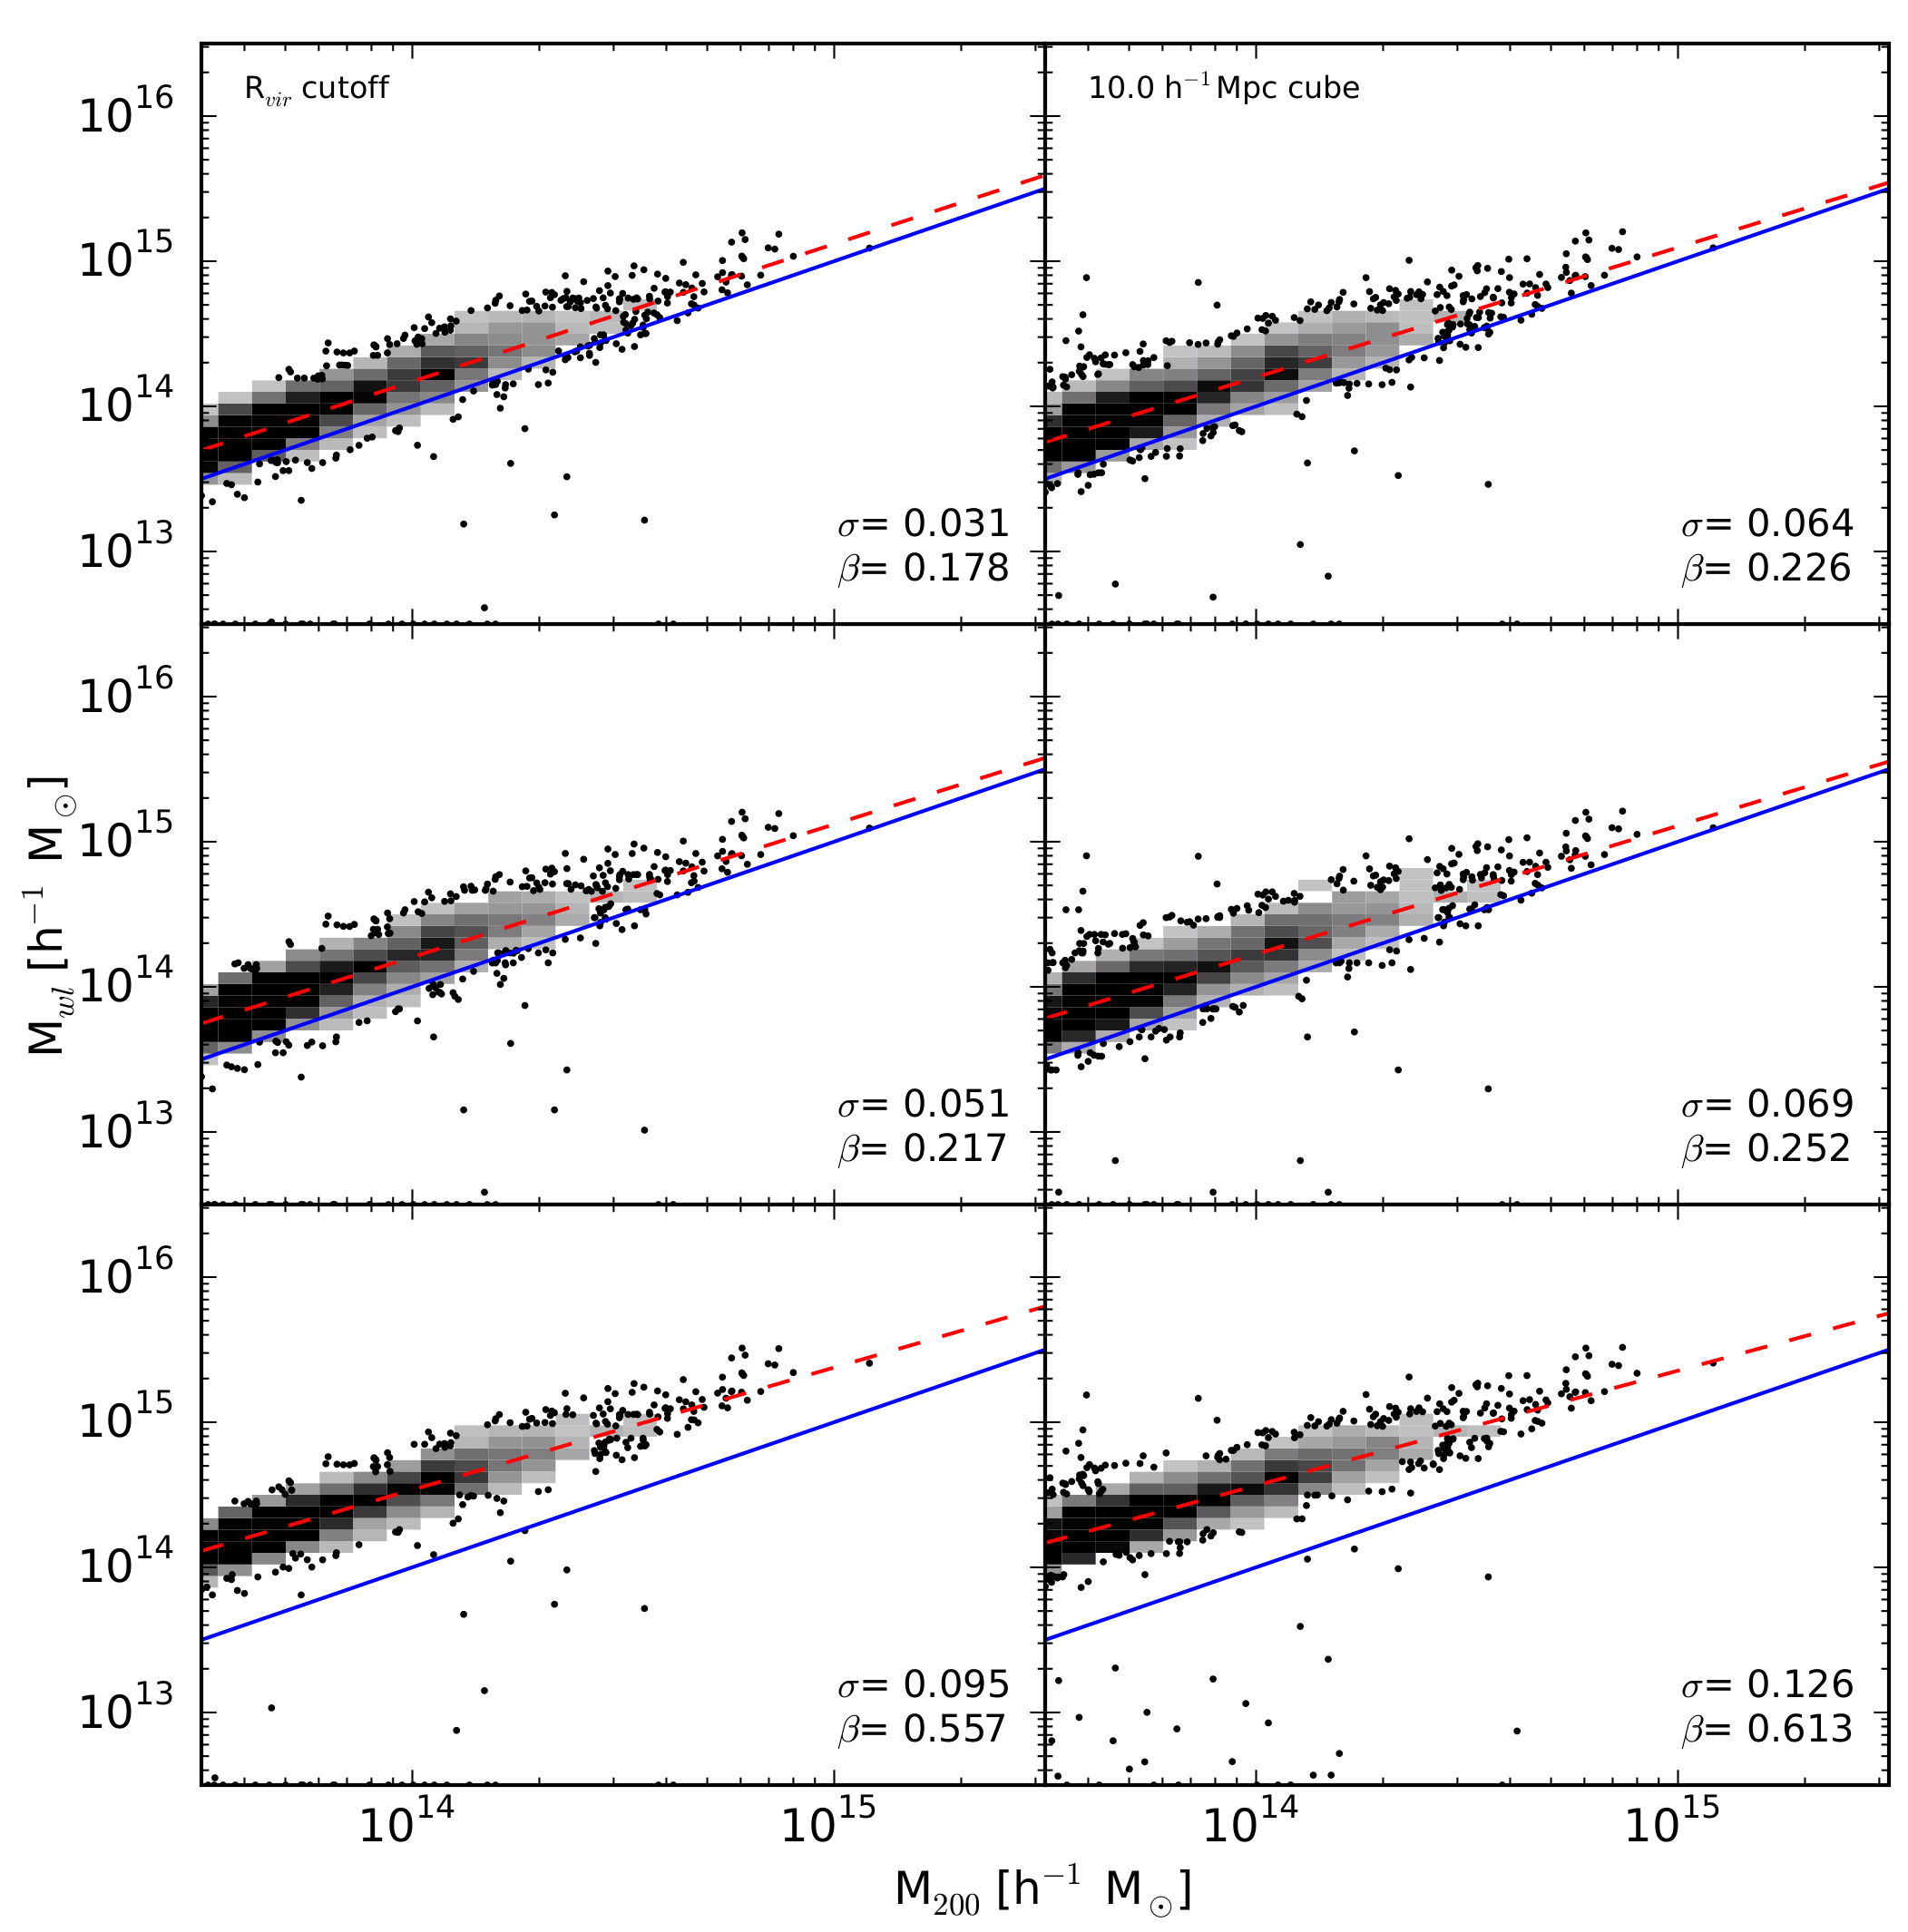
We see that for all density profiles there is a positive bias, and thus over prediction in mass.
The truncated NFW profile performs the best, and Einasto profile the worst, and this also
holds true for the standard deviation in the fits. With the introduction of local structure
the spread and bias unsurprisingly increase, with no change in order of performance of the
different models. These differences in spread and bias are statistically significant across all models.
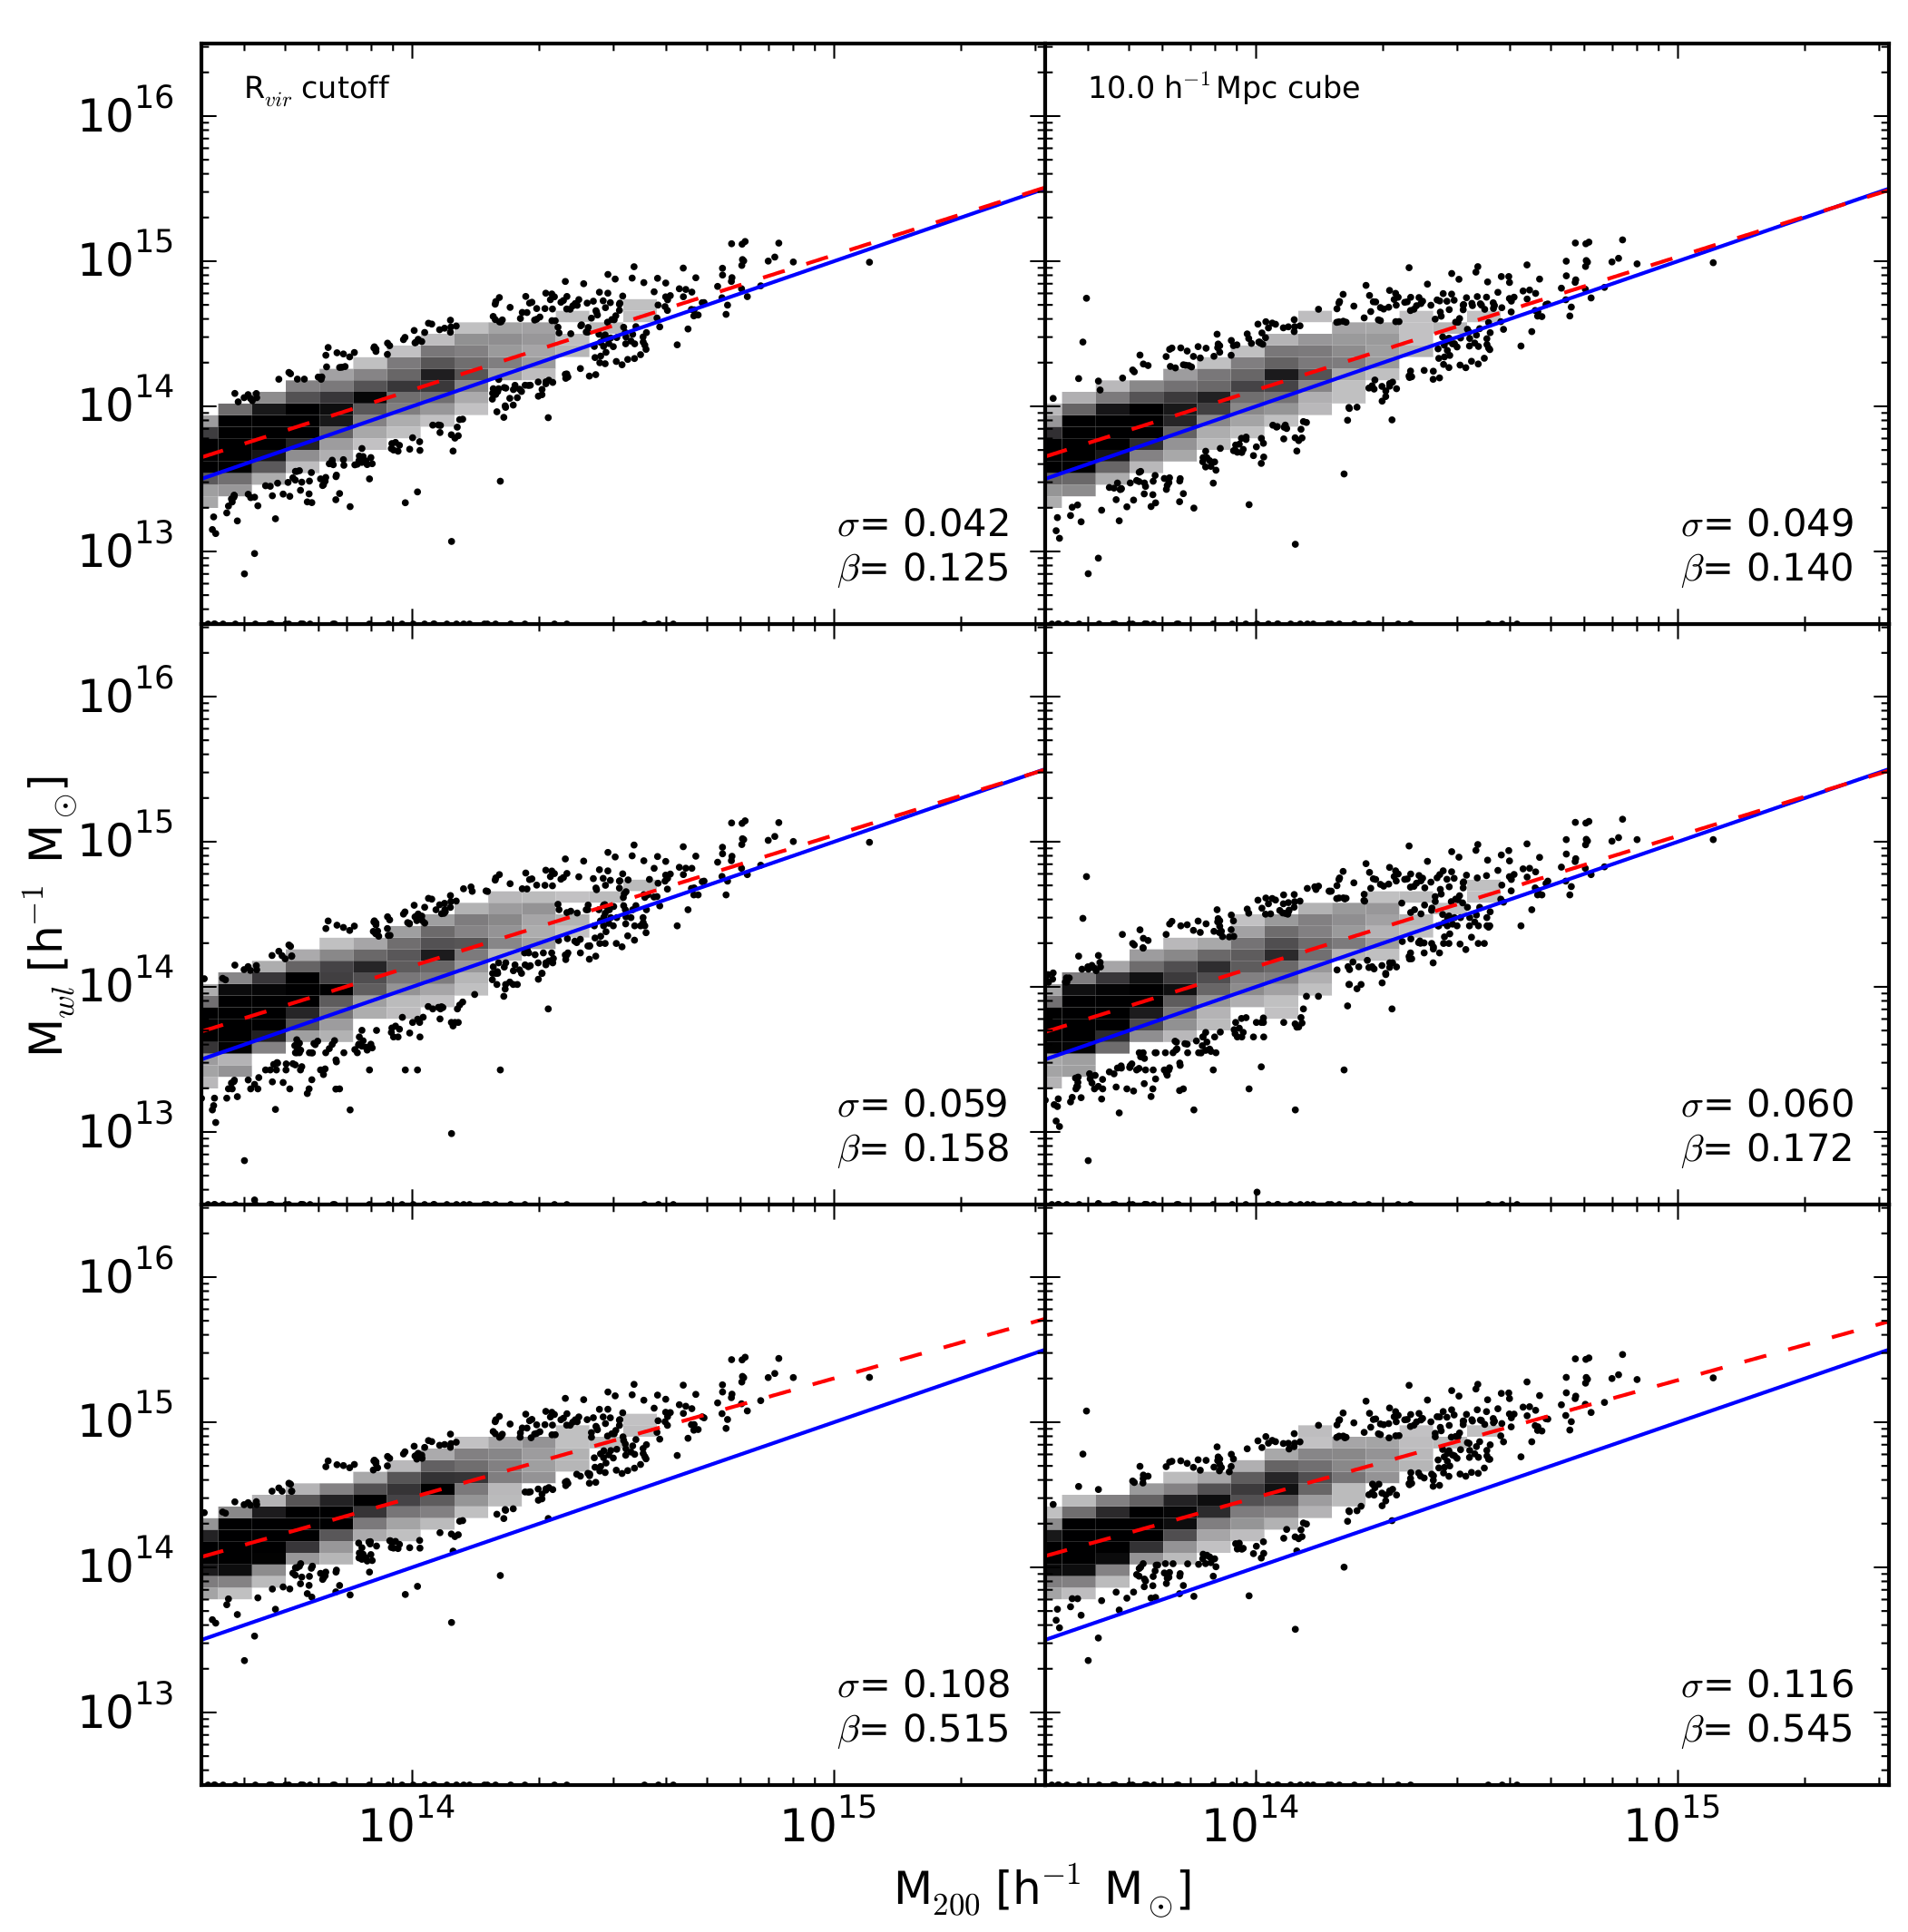
In Figure 3 we see the same style of plot as in Figure 2, but fits to the spherically symmetric component gtan
(what observers claim to measure). We see the same general trends as in Figure 1, however
fits to this component show a significantly lower bias than the gtot fits, and lower
spread with the inclusion of structure. This is the first indication of a difference
in gtot/gtan fits, hitting at the second major purpose of the dissertation.
In Figure 3 we see the same style of plot as in Figure 2, but fits to the spherically symmetric component gtan
(what observers claim to measure).
We see the significantly lower bias than the gtot fits, as gtot >= gtan.
Interestingly, we see increased spread on the spherical fits, but lower spread with the inclusion of structure.
The resiliency of gtan over gtot with structure can be understood due to
inhomogeneities in the 2D mass profile imposing a gsec component.
Results - Effect of Mass Along Line of Sight to Fits
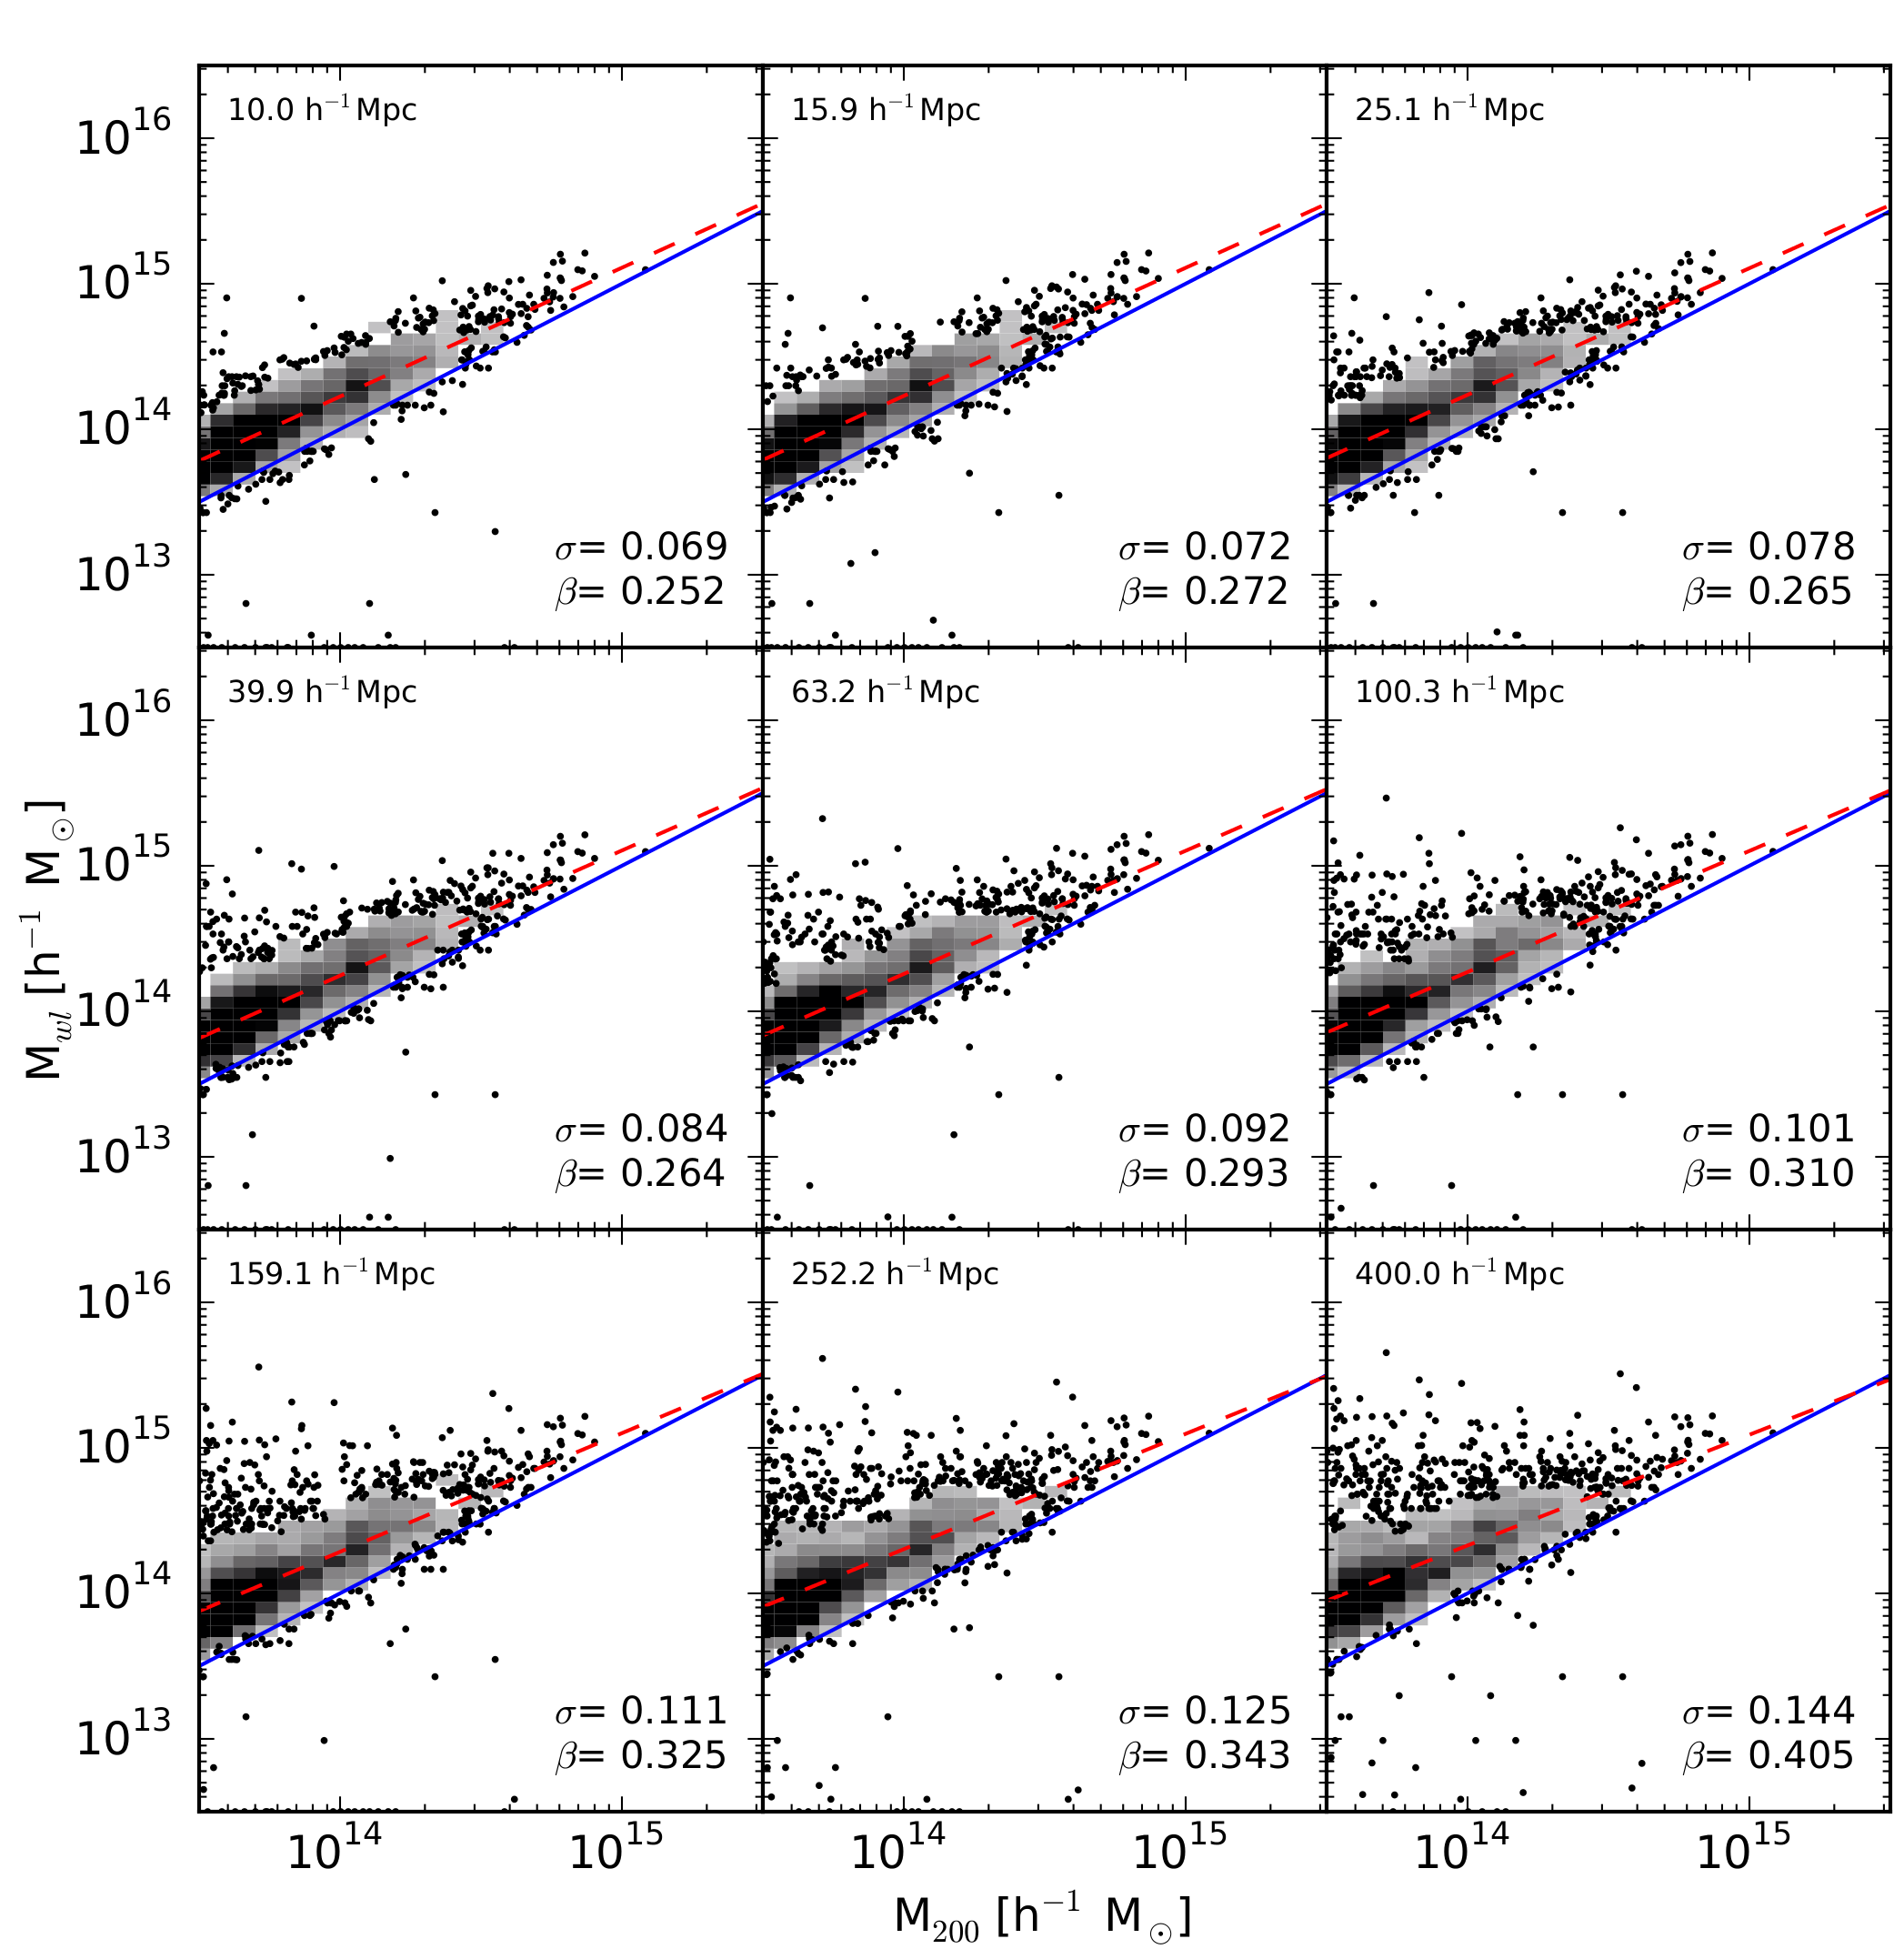
Figure 4 presents the same style of plot as in Figure 2, fitting with longer integration lengths,
for the NFW profile fits to gtot.
Uncorrelated structure along the line of sight forms a major source of
noise, and can have significant impact on the measured shear. For simplicity we will only show the
results for the NFW profile, but the trend is the same across all profiles.
As can be seen, with increasing
integration length more uncorrelated structure (junk) is added to the line of sight,
increasing both the scatter and bias. This is a huge issue for the low mass halos,
the most sensitive to the noise, rending many an order of magnitude high in estimated mass,
and makes our distribution non-homoscedastic.
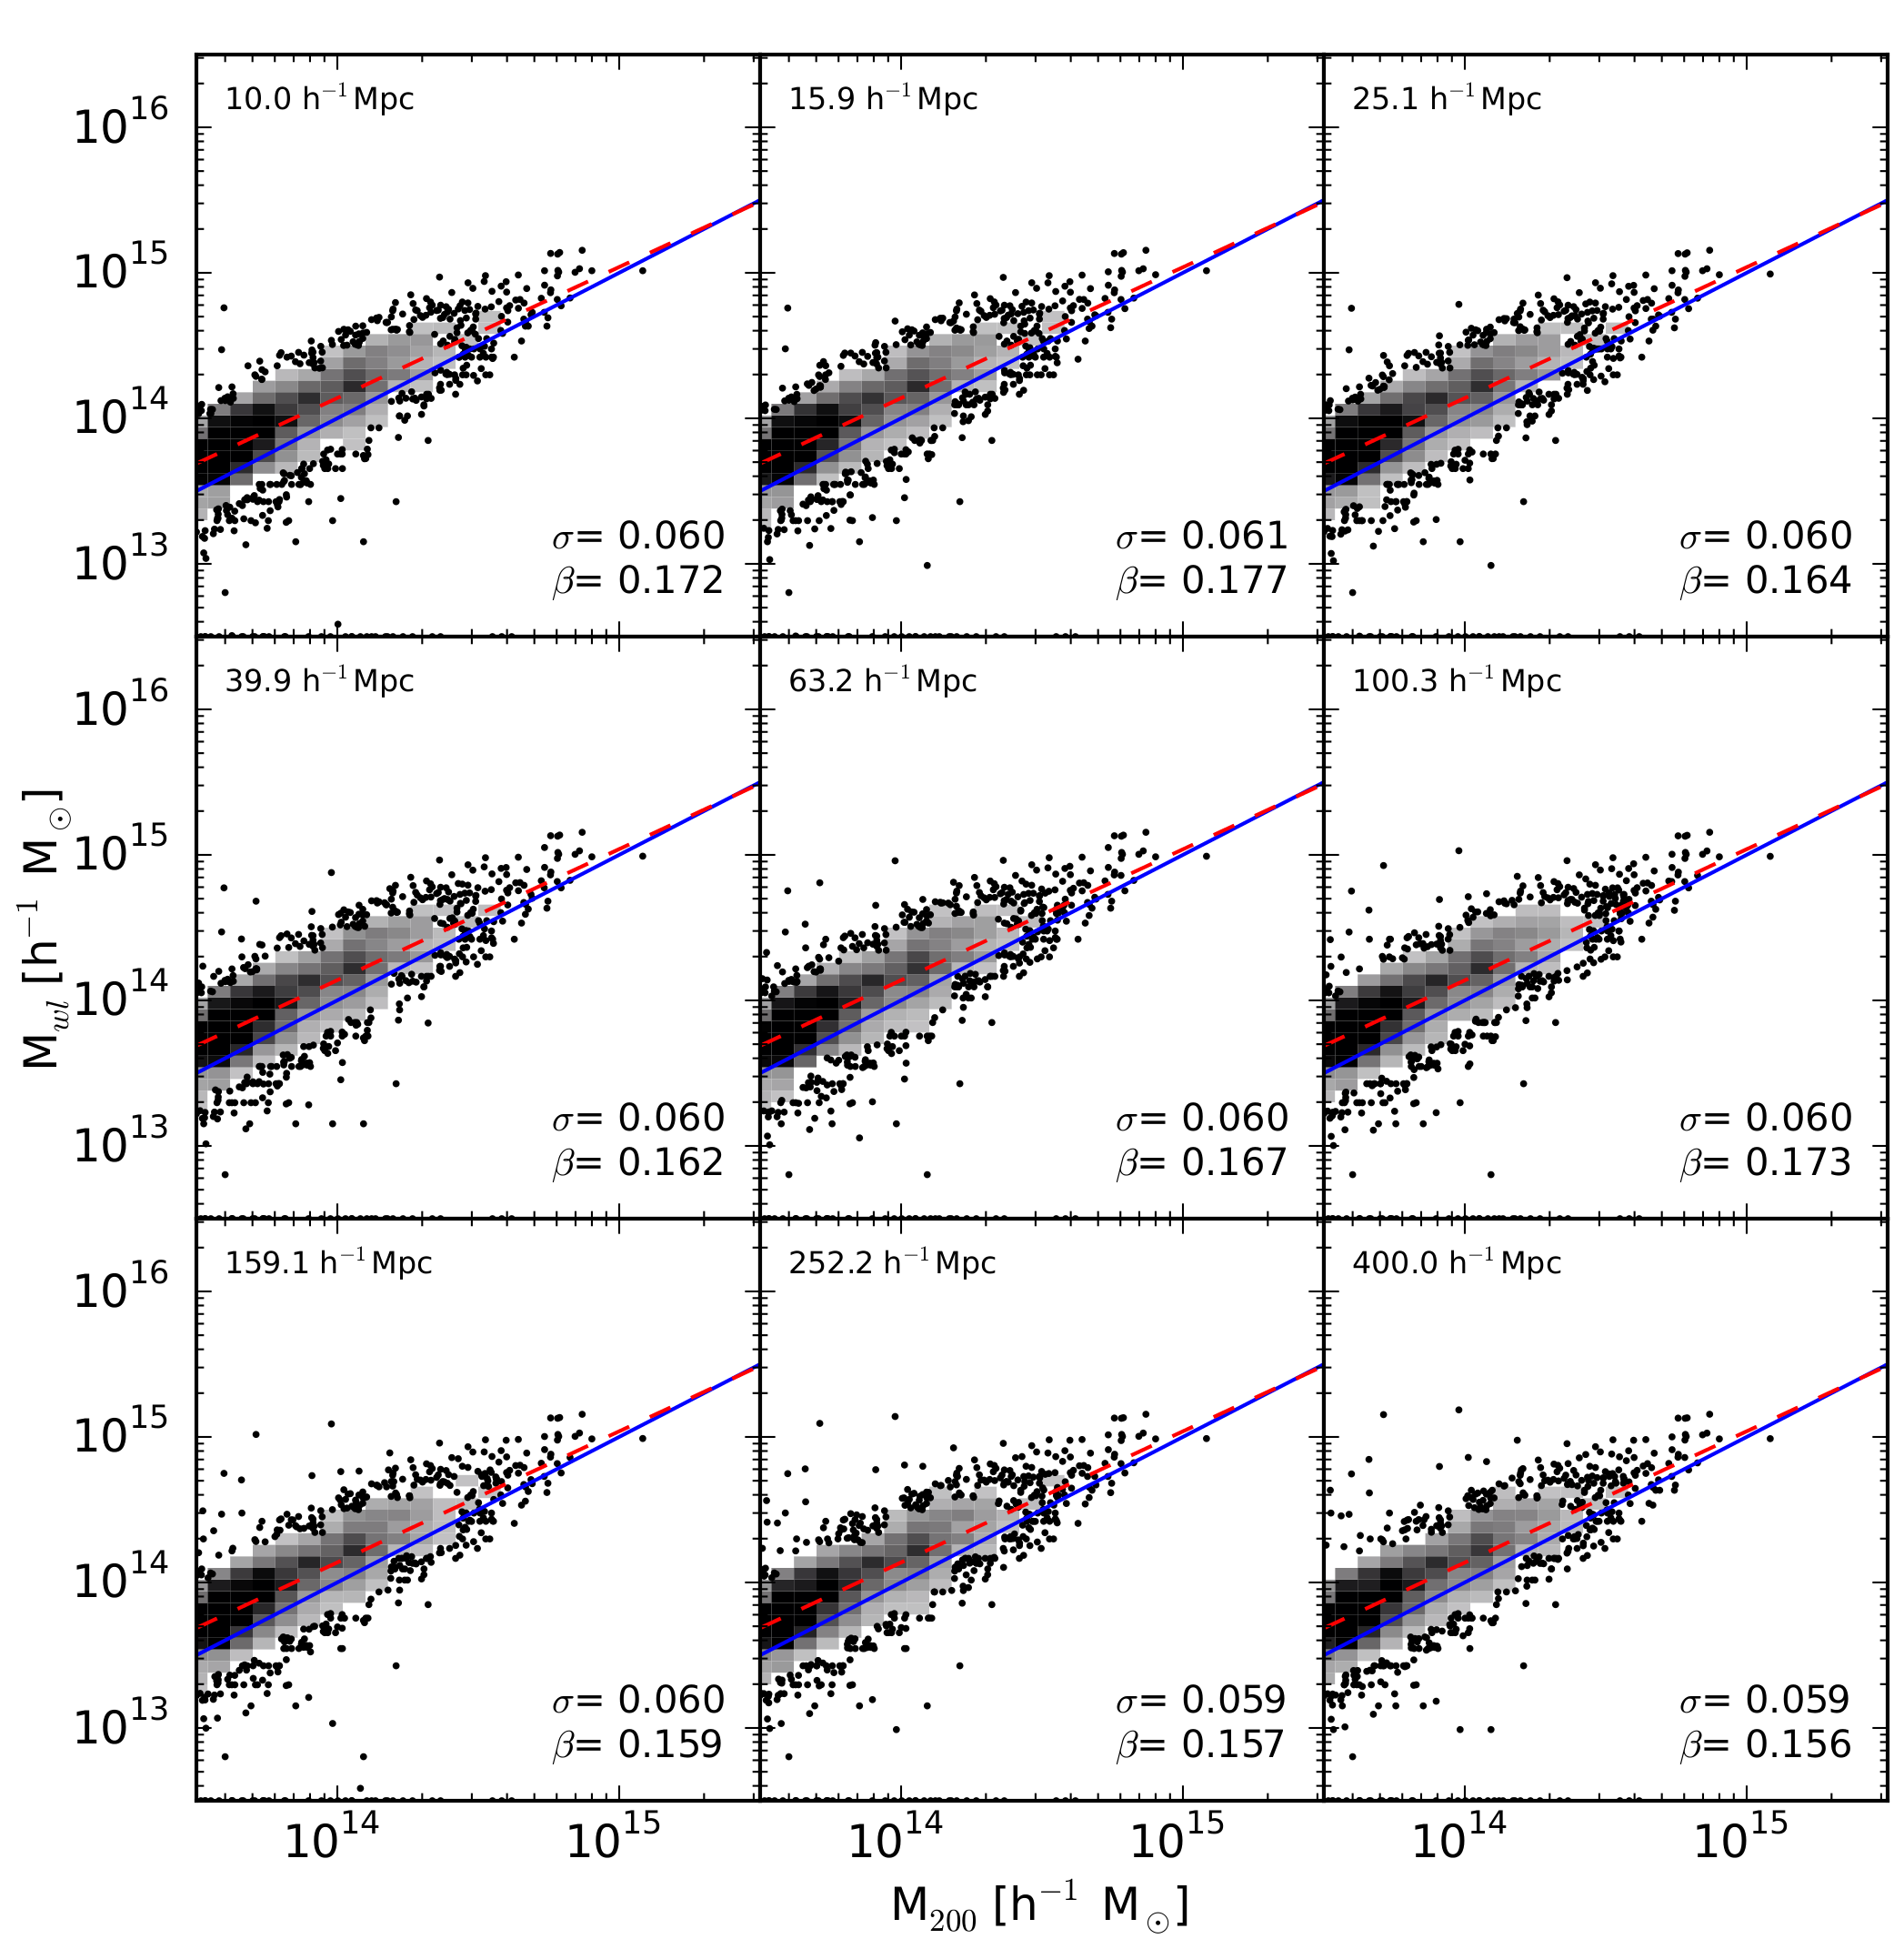
Figure 5 is the same style of plot as Figure 3, but as fits to gtan, what observers claim to
observe. This demonstrates a dramatic difference to the gtot case (what is actually
observed), with no statistically significant changes in standard deviation between integration steps,
and a homoscedastic spread across all masses. This indicates the noise induced by correlated structure does not
contribute significantly to gtan. The immense difference in gtot and gtan
fits has drastic consequences for any deep surveys utilizing weak lensing for mass estimation.
Results - Relative Contributions from Shear Components
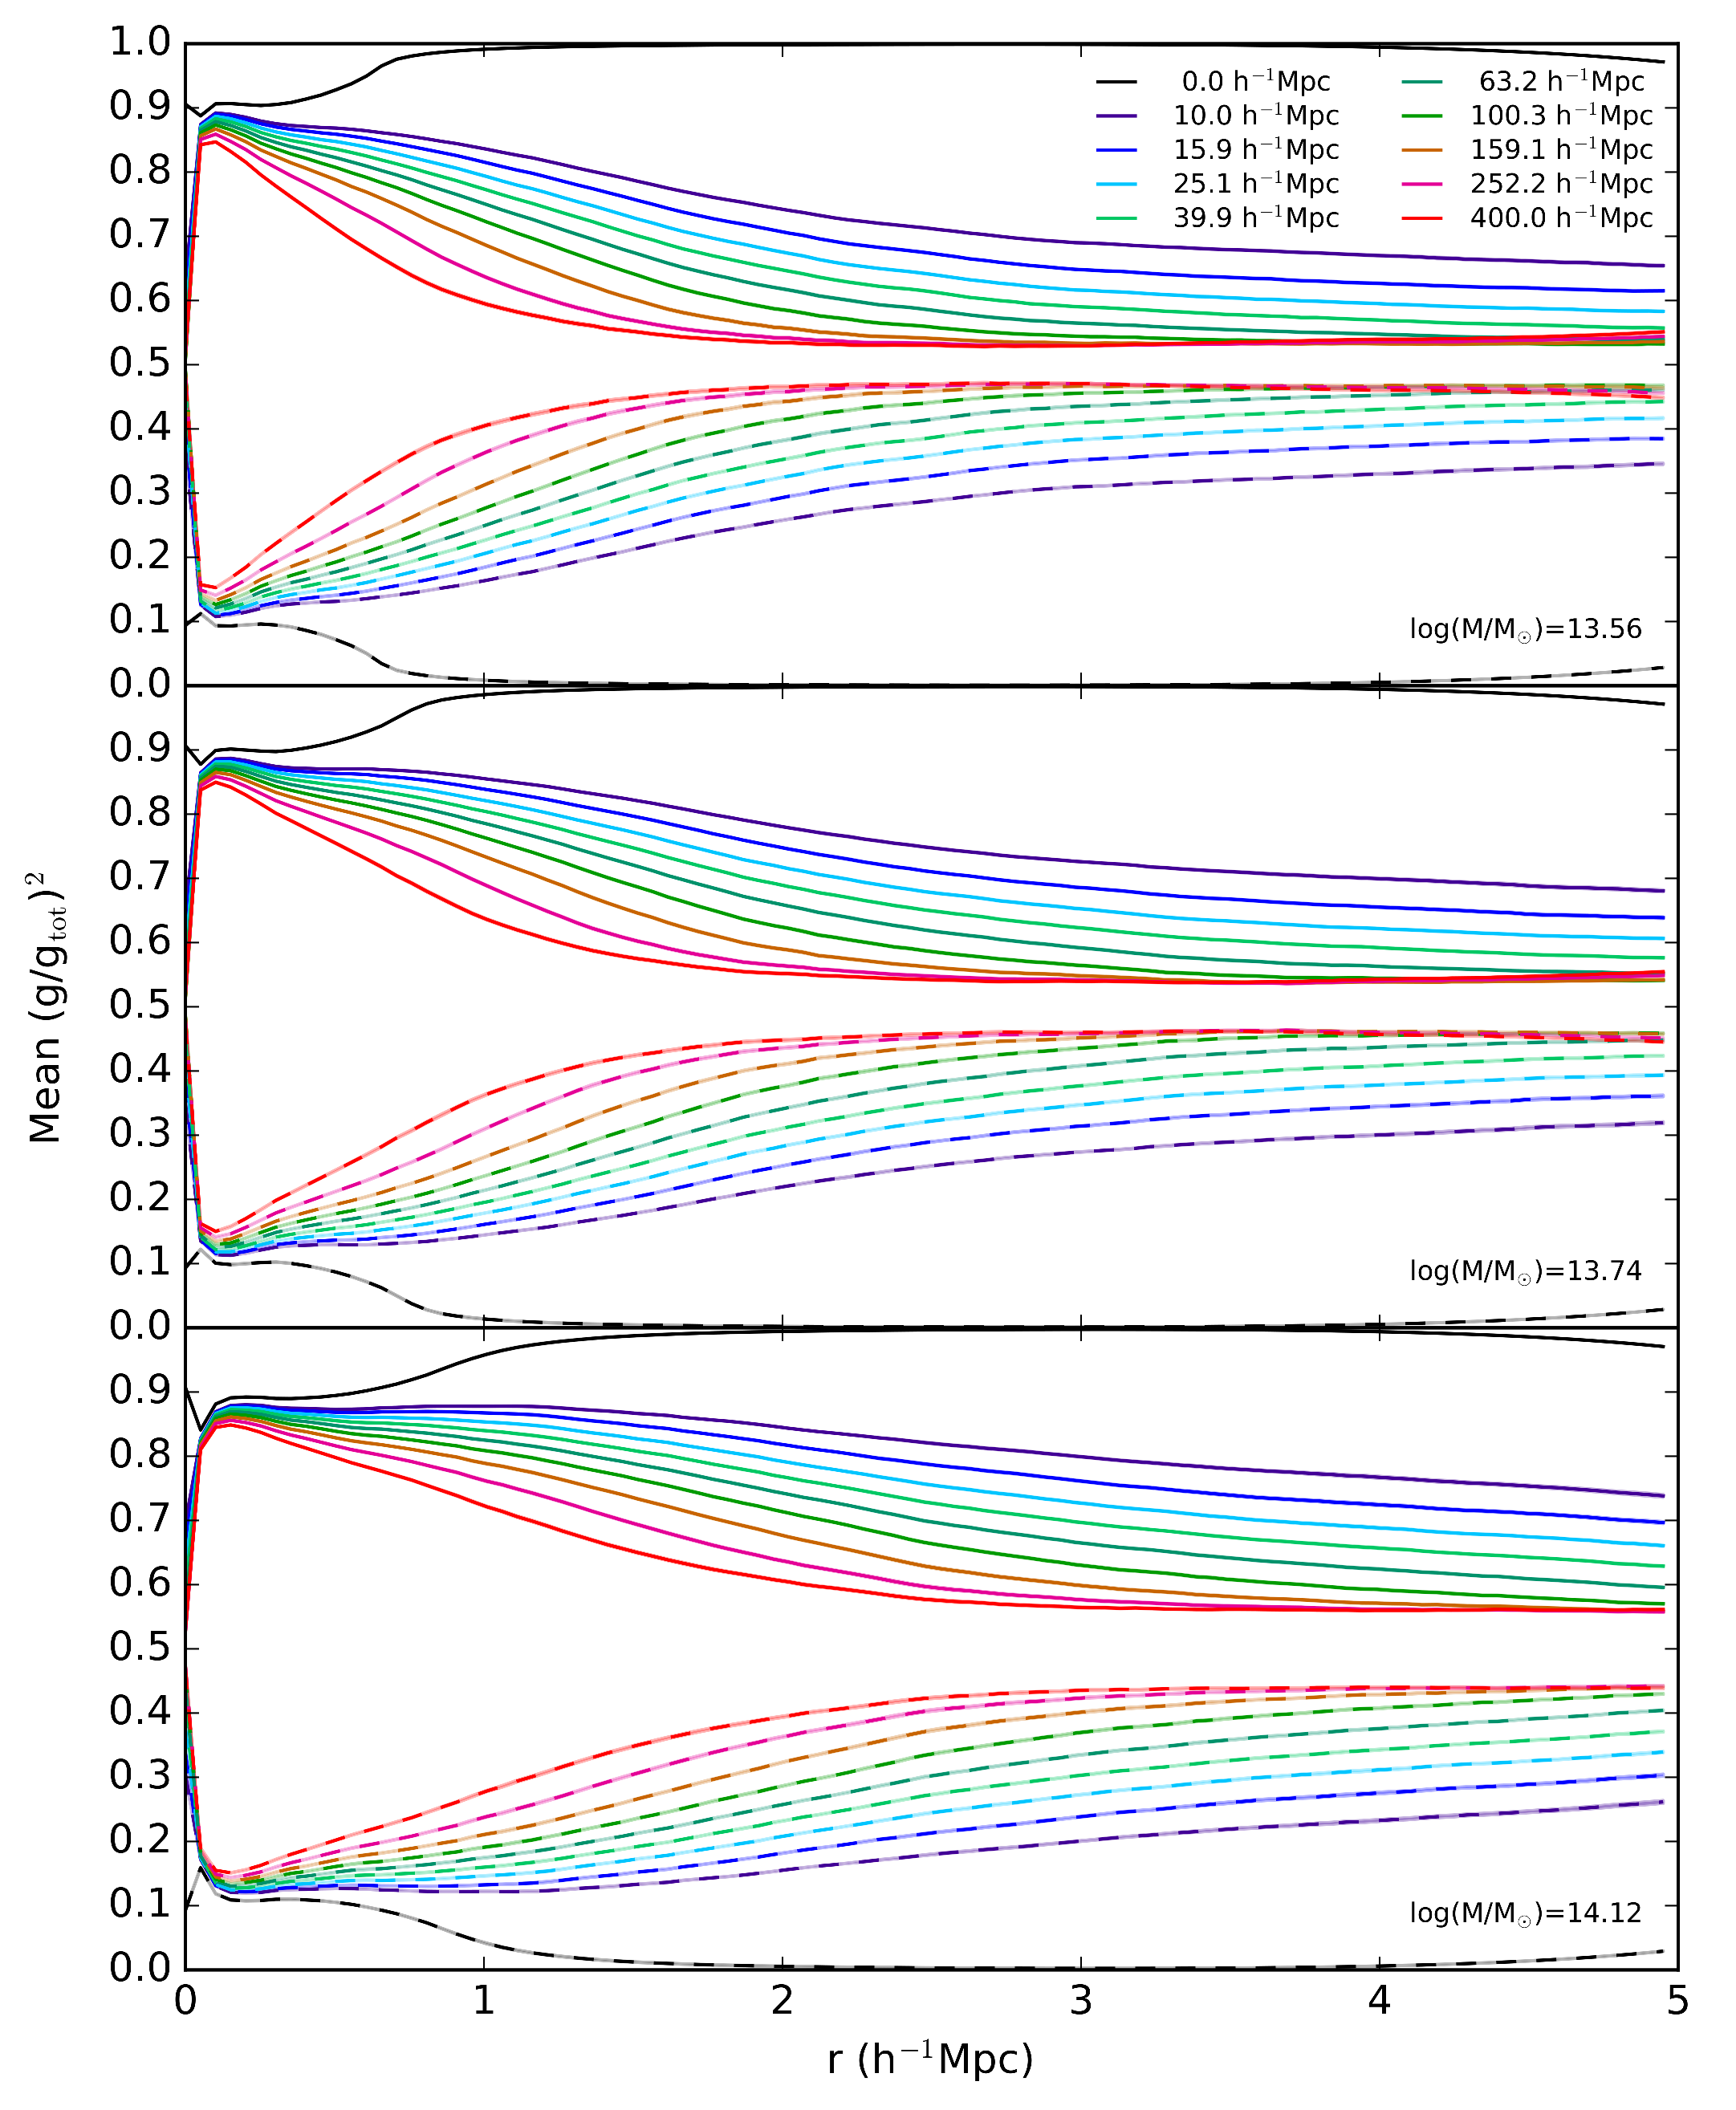
To study the difference between gtot and gtan, we can examine the relative
contributions of the two components, where gtot2 = gtan2 +
gsec2. We do this by averaging these values as a function of radius, using the
raw 2D mass maps, and not fitting any profile to them. Figure 6
shows the mean of the squared ratio of the two components gtan or gsec to
gtot, as a function of radius for the halo. We binned this into three mass bins,
with an equal number of bin members. The result is the fractional contribution of
gtan (solid) and gsec (dashed) to gtot, with the color being increased integration
length (matter along the line of sight). We see that in the low mass bin (top), the
contribution from gsec quickly increases at longer integration lengths. This is better
understood by scaling by the halo virial radius, as in Figure 7 below.
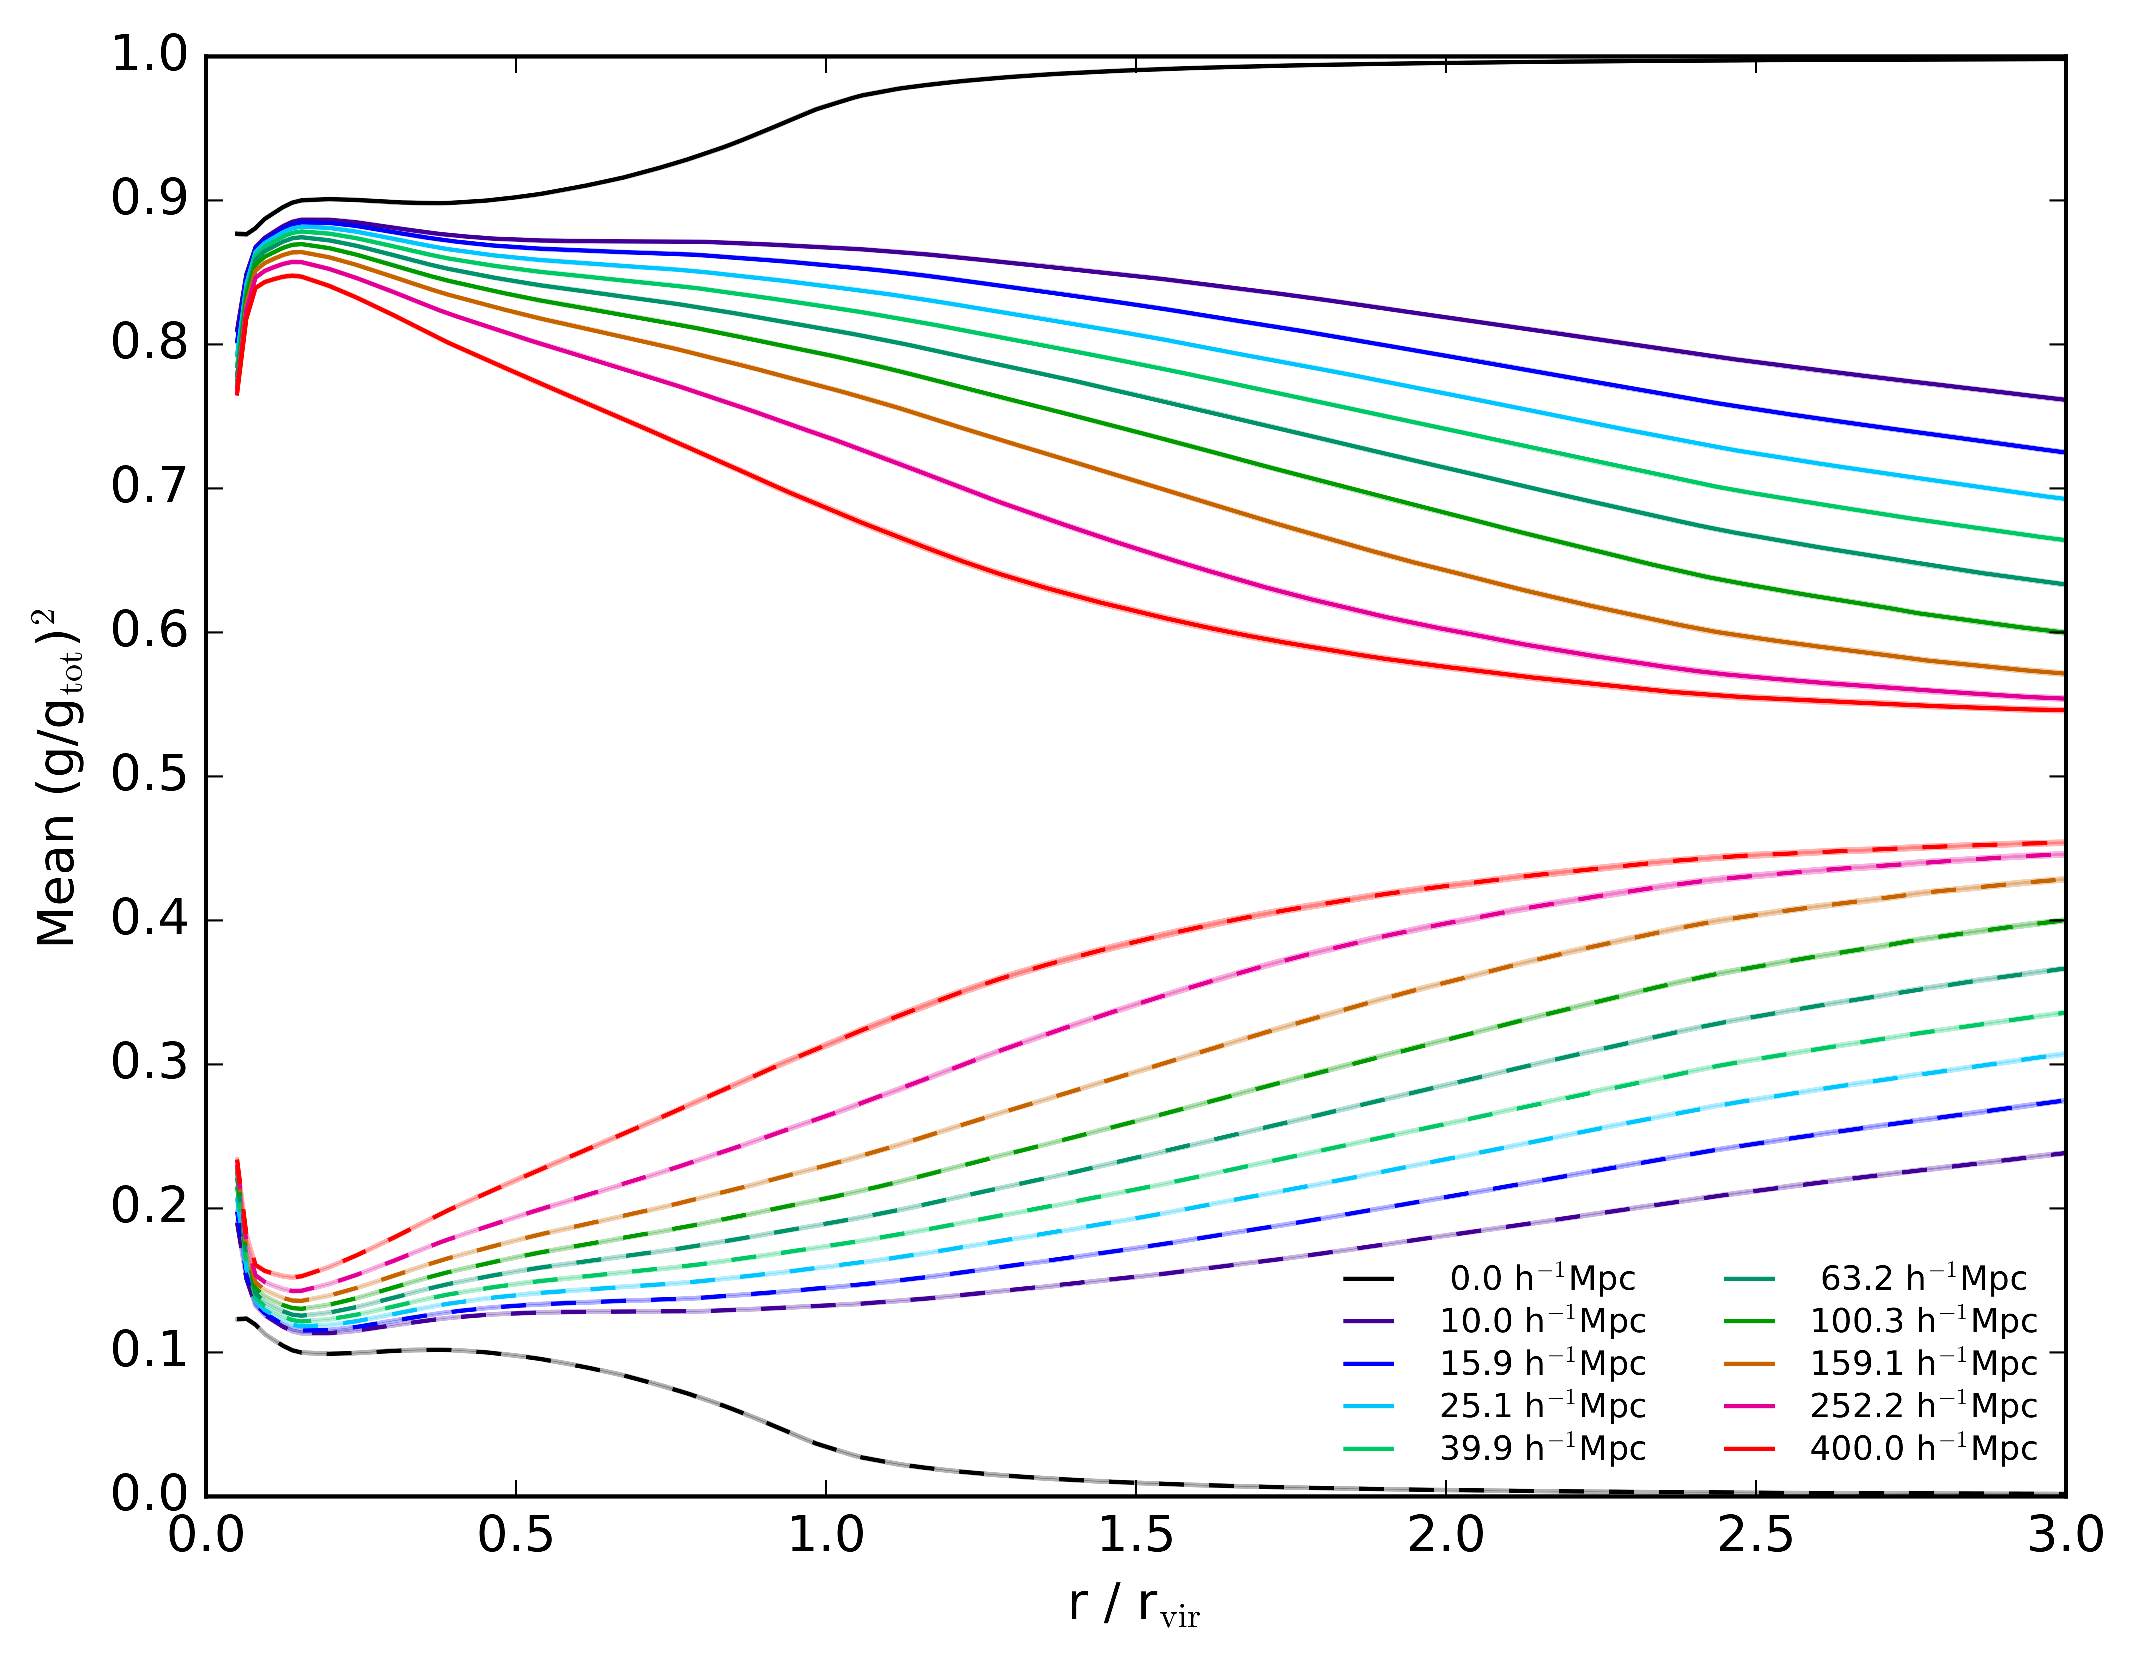
Figure 7 combines the bins in Figure 6 by scaling the radius to the virial
radius of each halo, so that the 1 on the x axis line up with the halo "edge".
The black line (rvir cutoff) clearly
shows that for the halo itself, the approximation of gtot=gtan is a good assumption, with
the inner regions having (gtan/gtot)2 > 0.9. However with the introduction
of local structure, the contributions from gsec increase, and at further integration lengths,
the observational approximation breaks down quickly.
In conclusion, we estimated tens of thousands of simulated halos masses, using weak gravitational lensing observational methods. The NFW profile surprisingly outperforms the Einasto profile in weak lensing mass estimation. Most importantly, the introduction of structure along the line of sight breaks down the observational approximation of gtot=gtan. The uncorrelated structure along the line of sight adds noise to the secant component of shear, reaching a similar level of contribution to the tangent component at a few virial radii for any large integration length. This is a massive barrier for observations, because many galaxy cluster lenses in surveys extend far further out than my maximum integration length of 400 h-1 Mpc distance, which as a distance alone would correlate with a redshift of z~0.1. At the time of this writing, some surveys extend to a redshift of z~0.55, which would correlate to an integration length of approximately 1.4 h-1 Gpc. Weak lensing as a cluster mass estimating methodology must find a way to overcome inhomogeneities in their integration as surveys explore deeper redshifts.
References
1 Applegate, D. E., von der Linden, A., Kelly, P. L., et al. 2014, MNRAS, 439, 48
2 Broadhurst, T., Takada, M., Umetsu, K., et al. 2005, ApJ, 619, L143
3 Clowe, D., & Schneider, P. 2001, ArXiv Astrophysics e-prints, astro-ph/0109260
4 Hayashi, E., & White, S. D. M. 2008, MNRAS, 388, 2
5 Klypin, A., Yepes, G., Gottlober, S., Prada, F., & Hess, S. 2014, ArXiv e-prints, arXiv:1411.4001
6 Klypin, A., Yepes, G., Gottl ̈ober, S., Prada, F., & Heß, S. 2016, MNRAS, 457, 4340
7 Mead, J. M. G., King, L. J., Sijacki, D., et al. 2010, MNRAS, 406, 434
8 Merritt, D., Graham, A. W., Moore, B., Diemand, J., & Terzi ́c, B. 2006, AJ, 132, 2685
9 Merten, J., Meneghetti, M., Postman, M., et al. 2015, ApJ, 806, 4
10 Navarro, J. F., Ludlow, A., Springel, V., et al. 2010, MNRAS, 402, 21
11 Retana-Montenegro, E., & Frutos-Alfaro, F. 2011, ArXiv e-prints, arXiv:1108.4905
12 Retana-Montenegro, E., van Hese, E., Gentile, G., Baes, M., & Frutos-Alfaro, F. 2012b, A&A, 540, A70
13 Stadel, J., Potter, D., Moore, B., et al. 2009, MNRAS, 398, L21
14 Taylor, J. E., Massey, R. J., Leauthaud, A., et al. 2012, ApJ, 749, 127
15 Wright, C. O., & Brainerd, T. G. 2000, ApJ, 534, 34
16 Zhang, Y.-Y., Finoguenov, A., B ̈ohringer, H., et al. 2008, A&A, 482, 451
17 Zitrin, A., Broadhurst, T., Umetsu, K., et al. 2009, MNRAS, 396, 1985
18 Zitrin, A., Rosati, P., Nonino, M., et al. 2012, ApJ, 749, 97
