Machine Learning Lifetimes
Here we will model the predicted lifetimes, using a machine learning approach. Generally machine learning is not the favored method, as the trained data relies on the cancellation data only, and can not easily take into account data we do not observe the cancellation on. Nonetheless, we can draw a comparison between the survival analysis and machine learning predictions.
As we did in the survival analysis, we break our model into two sets. One where
claims were filed, and one where claims were not filed. The set with no filed claims
contains two features, the premium, and the total premium paid to date. The set with
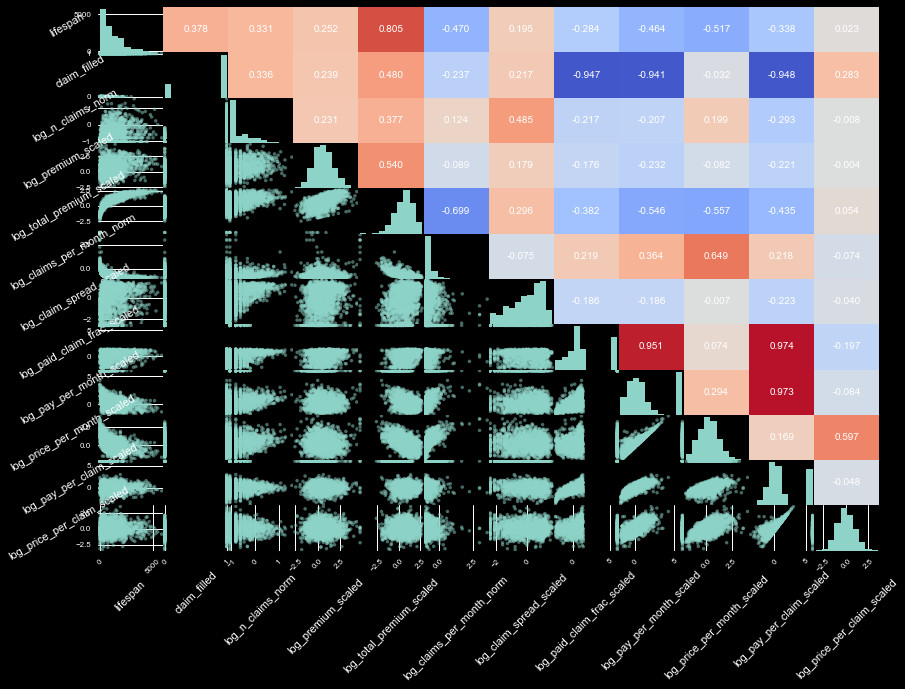
claims filed contain 14 features, the two from no claims, a flag for whether there
were multiple claims, the number of claims, the number of claims/month, the claim spread,
the fraction of claims paid, the amount paid per month, the amount paid per claim, and the
premium relative to the amount of claims. These were nearly all some z-scaled logarithm
of the actual values. We show the correlation of these variables all together in
(the very crowded) Figure 1.
We test numerous ML models on our data, with an 80/20 train/test split. We test
a Support Vector, Elastic Net, Random Tree, Random Forest, Bagging Regressor,
Adaboosted Regressor, and Neural Network. After cross validation on 20% chunks
of the training set, we choose to focus on the SVR, Random Forest, and Neural
Network regressor, which performed best in preliminary tests.
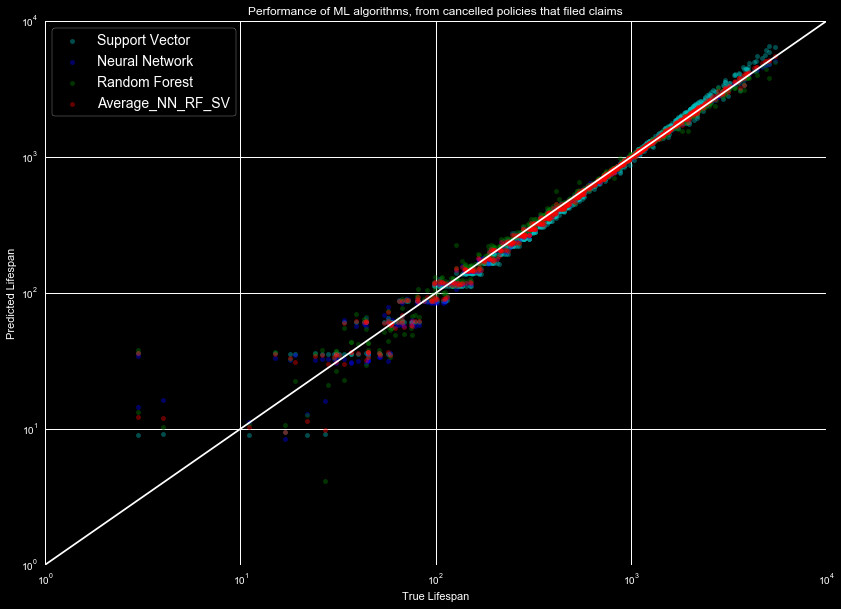
We show the results of the predicted lifetime against the real lifetime of the test
data for the data set with claims in Figure 2. Again, this is limited to predicting
for the data we have the cancellation information for, not for data where the lifespan
extends outside of 2016. We show our three models, as well as the average prediction
for all three.
If we instead look at the predictions for the data where claims were not filed,
we get the results seen in Figure 3. This shows a similar, tight trend over
several orders of magnitude, as in Figure 2.
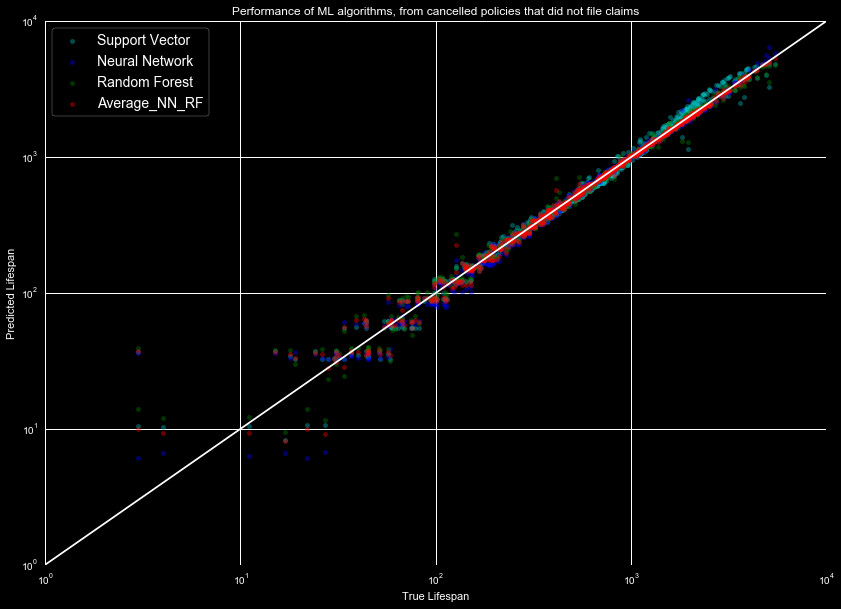
While the machine learning model is limited to training using only cancellation
data, it at least performs well when tested against other cancellation data.
We will compare these models to the survival function analysis in our next
section,
Results.