Developing a final model
It was clear from our previous results that the Sklearn model is more promising than the Tensorflow model. We will therefore use these to build a final model, testing them on our 20% holdout data, and submitting predictions to the Kaggle competition we obtained the data from. This competition data is separate from data used to train the model.
Voting Model
The three (Row/Column, Image, Combined) models we used had accuracies ranging from 90-97% on our test data. It's unlikely all of these models overlap in their predictions, so let's test what a simple voting algorithm provides. When uncombined, there are 953 unique mispredictions. If we implement a best 2 of 3 voting algorithm, the mispredictions drop to 244/8400, or about 3%.

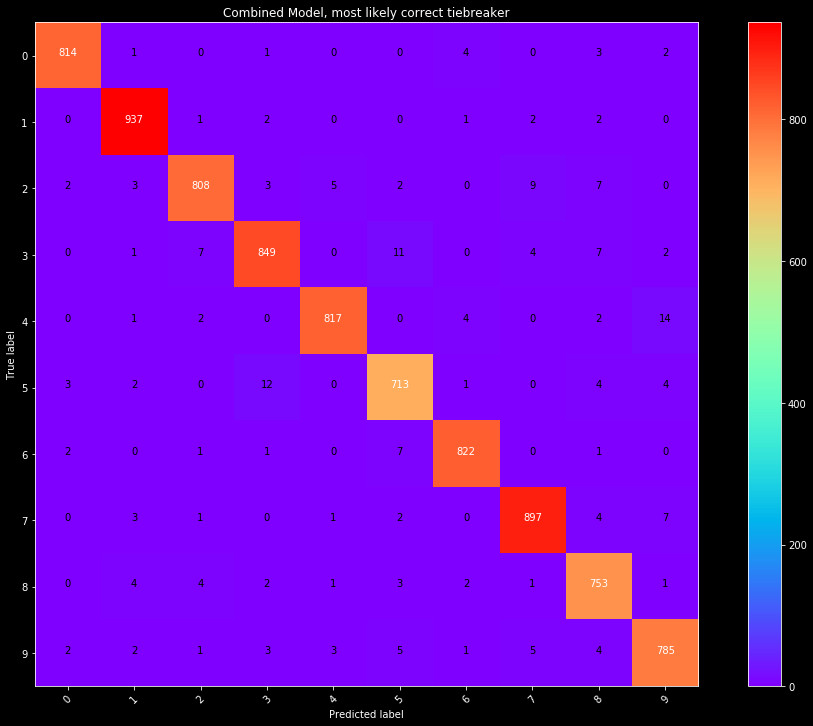
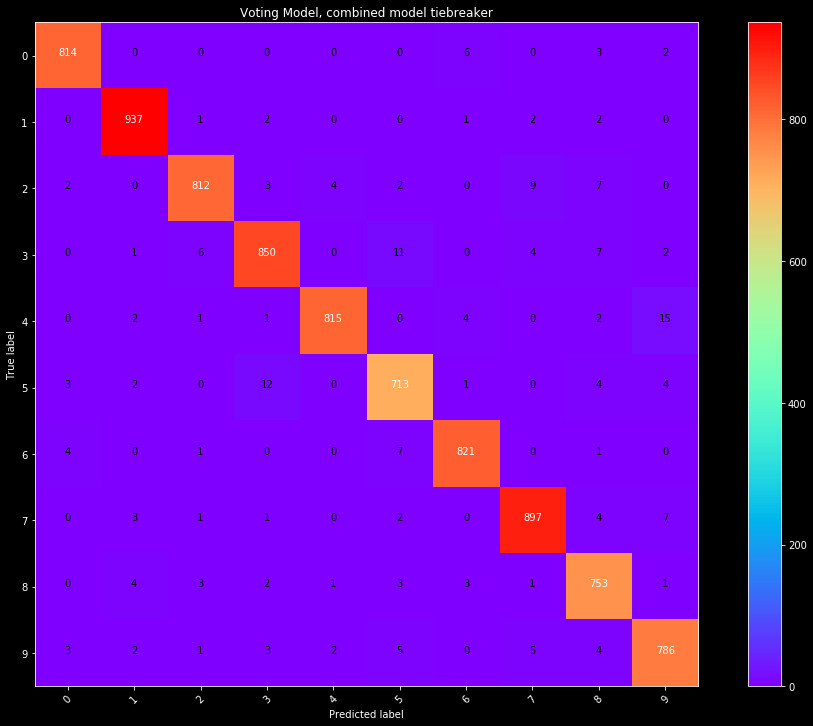
Figure 1: Confusion matrix for predictions on the combined voting. Consensus voting
indicates a 98% chance that the prediction is correct.
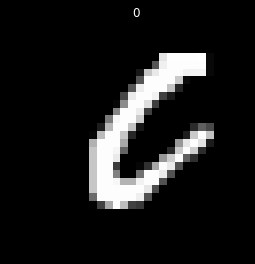
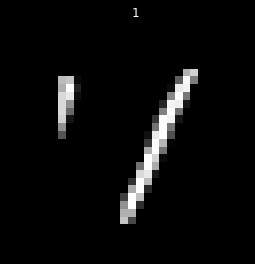
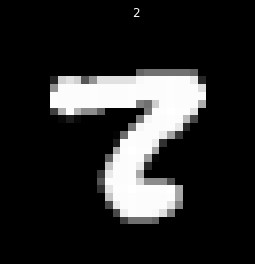
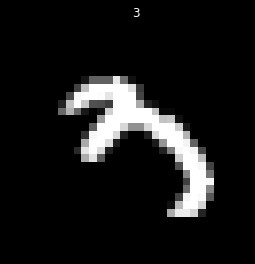
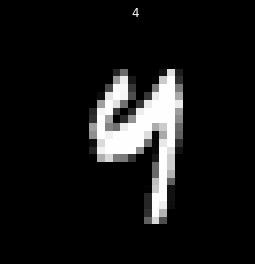
The question now becomes what to do when there is no consensus. First, let's have a look at what numbers are hard to classify, and see if there is insight into why:
 |
 |
 |
 |
 |
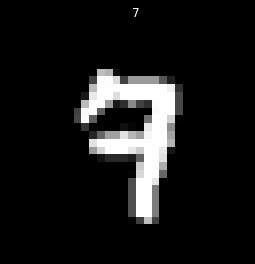 |
Well, it's no surprise our algorithm has issues. These numbers are tough to read for a human. This is only a subsample of the images, but a quick glance indicates these are going to all be difficult to read. For our purposes, errors in reading poorly written numbers is alright. We could work hard to optimize reading of these, however, given handwriting errors, or pens running out of ink, or errors taking the pictures, this is a futile effort. We can only force the algorithm to be so accurate, and want an algorithm that focuses on matching legible numbers, as opposed to something overfit to our dataset.
Therefore, we settle on 3 different models for a break in voting consensus. Looking at the breakdown of the Row/Col, Img, and Combined models, we can calculate the fraction of time they are correct in their prediction. Some models are better at catching certain numbers, and this would provide them more weight. Two models appear from this, where we can take the model that is correct in their prediction most often, or randomly select based on this weight. Randomness is not appreciated in a model, but is an option. The third model simply assumes the most accurate model is correct, and takes the selection from the Combined model.
 |
 |
 |
Final Scores
The last thing to do is submit our final results to Kaggle. The competition uses 25% of the test data to calculate the public score. Unfortunately due to the nature of this problem, the leaderboard is rife with people who have cheated by selecting values by eye, and have a 100% score. A quality classifier is not perfect, and will sit in the high 90s. Our final results are:
| Classifier | Accuracy |
| Combined Model | 97.9% |
| Combined Model as tiebreaker | 97.7% |
| Maximum Likelihood as tiebreaker | 97.7% |
| Randomized tiebreaker | 97.6% |
It appears our Combined Model may outperform our tiebreaking schemes. Approaching 98% accuracy is very commendable giving the simplicity of the model, and variations in handwriting. The fact these percentages are similar to that of our test set, suggests we have a robust and well biased model, and did not overfit. Sklearn is extremely easy to implement, and outperformed the Tensorflow model, making it my choice tool in future machine learning.