Data Exploration
Weekly data was downloaded using the nfl_data_py package. Play by play data was selected and aggregated by game and team for all available data (1999-present). The data was extensive, with nearly 400 features for each play. Some of these are clearly relevant for our purposes, such as "rushing_yards", however some are less, such as "timeout".
Relevant fields for fantasy football generally involve touchdown, yardage, the number of 40+ yard plays, sacks, pass attempts, kick attempts, and turnovers. We select relevant fields, and translate the play-by-play data to sums of yards and counts of occurrences over the course of a game. In the end we trim down the number of fields considerably, and are left with 37 fields that describe the state of the game for a team, corresponding to fantasy football metrics. The remaining fields are:
["season", "week", "team", "opponent", "rushing_yards", "passing_yards", "receiving_yards", "return_yards", "passing_yards_40", "rushing_receiving_yards_40", "touchdown", "pass_touchdown", "rush_touchdown", "return_touchdown", "two_point_attempt", "two_point_conv_success", "td_yards_40", "extra_point_attempt", "extra_point_success", "field_goal_attempt", "field_goal_success", "kick_distance_0_39", "kick_distance_40_49", "kick_distance_50", "interception", "fumble", "fumble_forced", "fumble_not_forced", "penalty", "penalty_yards", "assist_tackle", "qb_hit", "solo_tackle", "sack", "points", "opponent_points", "win"]
Having a look at the data, we can see there is some level of variation over time, though some data remains relatively constant. The number of carries in the game has been relatively constant per year.
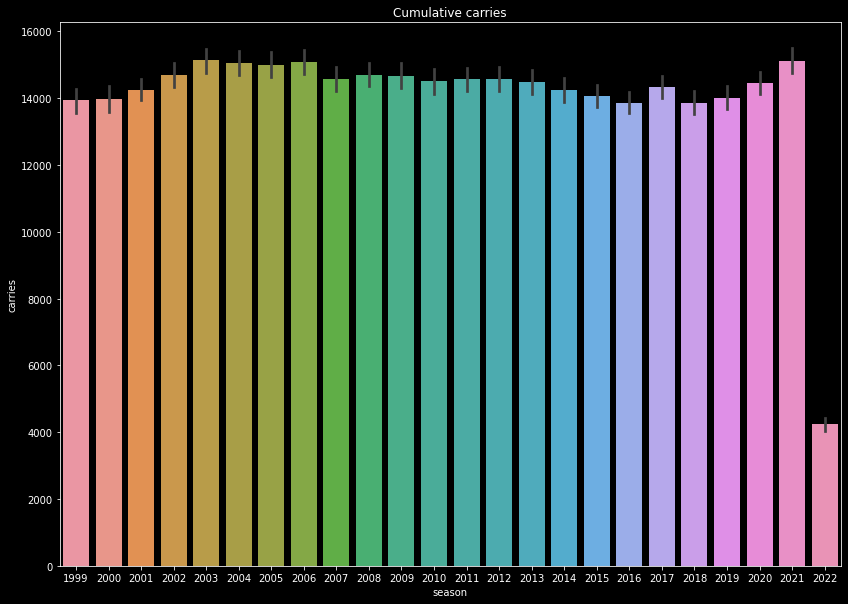
The number of carries per season since 1999.
The number of passing plays has increased over time, due to better passing lines. This has lead to an increase of things like passing touchdowns.
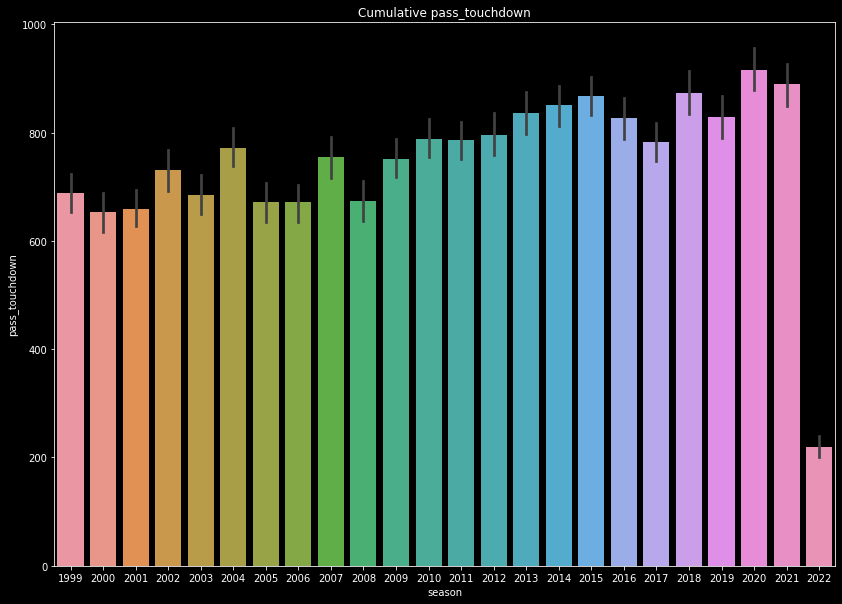
The number of passing touchdowns have increased over time, due to better passing lines.
Some fields have experienced dramatic increases, such as for 2 point conversions. The extra point kicking distance was increased in 2015, leading to an increase in two point conversion plays. This is clearly visible in our data.
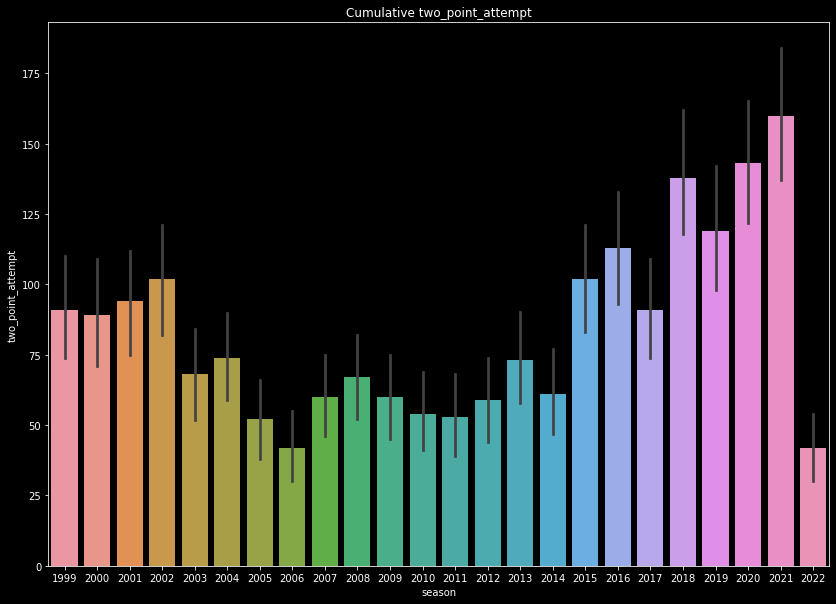
The number of two point conversions spiked after 2015, due to rule changes.
Now we average the weekly data over time to generate our features. We want a length that captures the team's abilities, but also factors in variations in the team's plays and rosters. We compare correlations of a few rollback dates, and find 3 is a good rolling average to use. We thus use a rolling average of three weeks, and shift the data by a week to avoid the overlap a moving average causes.
We have a list of features that uses rolling averages of previous games for forecasting the next game. This is a good start, but we need to consider another factor - the opposing team. The performance of the other team will have a huge impact on the fantasy football results. So, we attach a subset of the opponent's features to a given team's set. In the end, we have roughly 30 features that we use to fit out ML models.